TR3 SHELL-MITC element hyperboloid validation
This validation aims at assessing the behavior of the SesamX TR3 SHELL-MITC element (MITC3 element) against the equivalent Abaqus S3 element. We expect to notice some discrepancies between these elements because their formulations are different.
Validation model
An hyperboloid-like model is studied for this comparison.


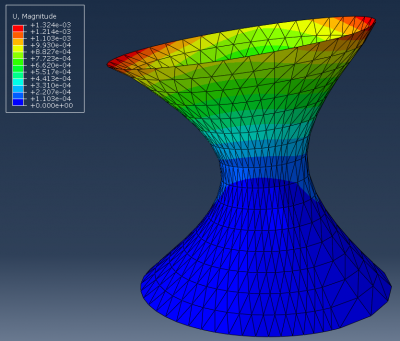
The mesh is voluntarily distorted and curved in order to assess the robustness of the element. The bottom nodes circle are clamped while a uniformly distributed load along the $x$ axis is applied at the top nodes circle. A thickness of $80 mm$ is applied on the shell elements. A linear elastic material is applied with $E = 200 GPa$ and $ν = 0.33$.
This case is solved as a linear static resolution.
Validation results
The following figure gives an overview of the hyperboloid displacement.
Validation data
The following table gives the comparison of the nodal translations between Abaqus and SesamX.
| Abaqus | SesamX | Comparison | |||||||
|---|---|---|---|---|---|---|---|---|---|
| Node id | $u_x (m)$ | $u_y (m)$ | $u_z (m)$ | Magnitude $(m)$ | $u_x (m)$ | $u_y (m)$ | $u_z (m)$ | Magnitude $(m)$ | Magnitude error |
| 1 | -2.15E-33 | -3.08E-32 | 2.34E-32 | 1.07E-03 | 0.00E+00 | 0.00E+00 | 0.00E+00 | 0.00E+00 | - |
| 200 | -1.19E-05 | -2.02E-06 | -4.31E-05 | 4.47E-05 | -1.19E-05 | -2.04E-06 | -4.31E-05 | 4.48E-05 | 0.14% |
| 400 | 3.86E-04 | 9.26E-07 | -2.18E-04 | 4.43E-04 | 3.86E-04 | 1.18E-06 | -2.18E-04 | 4.43E-04 | 0.04% |
| 571 | 9.24E-04 | -5.45E-05 | 4.13E-04 | 1.01E-03 | 9.26E-04 | -5.62E-05 | 4.15E-04 | 1.02E-03 | 0.27% |
| 583 | 1.01E-03 | 8.40E-06 | -8.54E-04 | 1.32E-03 | 1.01E-03 | 8.44E-06 | -8.56E-04 | 1.33E-03 | 0.21% |
| 596 | 9.28E-04 | 4.66E-05 | 4.09E-04 | 1.01E-03 | 9.29E-04 | 4.70E-05 | 4.10E-04 | 1.02E-03 | 0.16% |
| 608 | 9.34E-04 | -5.45E-05 | 5.21E-04 | 1.07E-03 | 9.36E-04 | -5.62E-05 | 5.23E-04 | 1.07E-03 | 0.26% |
The maximum difference is 0.3%. The nodal translation are very close between Abaqus and SesamX.
The following table gives the comparison of the nodal rotations between Abaqus and SesamX.
| Abaqus | SesamX | Comparison | |||||||
|---|---|---|---|---|---|---|---|---|---|
| Node id | $r_x (rad)$ | $r_y (rad)$ | $r_z (rad)$ | Magnitude (rad) | $r_x (rad)$ | $r_y (rad)$ | $r_z (rad)$ | Magnitude $(rad)$ | Magnitude error |
| 1 | -8.26E-35 | -6.88E-35 | -4.86E-35 | 8.50E-05 | 0.00E+00 | 0.00E+00 | 0.00E+00 | 0.00E+00 | - |
| 200 | 4.24E-06 | 9.68E-06 | -2.71E-06 | 1.09E-05 | 4.31E-06 | 9.46E-06 | -2.73E-06 | 1.07E-05 | -1.52% |
| 400 | 8.60E-06 | 5.61E-05 | 1.91E-06 | 5.67E-05 | 6.84E-06 | 5.55E-05 | 2.51E-06 | 5.60E-05 | -1.38% |
| 571 | 3.11E-05 | 7.16E-05 | 3.94E-06 | 7.82E-05 | 4.26E-05 | 4.44E-05 | 3.11E-05 | 6.89E-05 | -11.82% |
| 583 | -7.53E-06 | 1.53E-04 | -6.81E-08 | 1.53E-04 | 6.09E-05 | 1.49E-04 | -6.19E-05 | 1.73E-04 | 12.62% |
| 596 | -4.15E-05 | 8.17E-05 | -5.69E-06 | 9.18E-05 | -1.46E-06 | 1.43E-04 | 6.18E-05 | 1.56E-04 | 69.50% |
| 608 | 3.73E-05 | 7.63E-05 | -1.97E-06 | 8.50E-05 | 5.60E-05 | 4.66E-05 | 3.07E-05 | 7.90E-05 | -7.00% |
The maximum difference on the rotations is 70%. The differences on the rotations are larger than on the translations. But, as for the QD4 SHELL-MITC element validation we must be cautious about these results. Indeed, the Abaqus S3 element seems to have 6 degrees of freedom per node, while the MITC3 element implemented in SesamX has only 5 (no drilling rotation). Hence the S3 adds inevitably some terms on the rotational degrees of freedom.
The following table gives the comparison of the principal strains on the shell top surface between Abaqus and SesamX.
| Abaqus | SesamX | Comparison | ||||
|---|---|---|---|---|---|---|
| Element id | $\varepsilon_{11} (\%)$ | $\varepsilon_{22} (\%)$ | $\varepsilon_{11} (\%)$ | $\varepsilon_{22} (\%)$ | $\varepsilon_{11}$ error | $\varepsilon_{22}$ error |
| 244 | 7.38E-04 | 6.49E-05 | 7.40E-04 | 6.38E-05 | 0.25% | -1.75% |
| 261 | 5.84E-04 | -1.02E-03 | 5.84E-04 | -1.02E-03 | 0.00% | -0.03% |
The following table gives the comparison of the principal strains on the shell bottom surface between Abaqus and SesamX.
| Abaqus | SesamX | Comparison | ||||
|---|---|---|---|---|---|---|
| Element id | $\varepsilon_{11} (\%)$ | $\varepsilon_{22} (\%)$ | $\varepsilon_{11} (\%)$ | $\varepsilon_{22} (\%)$ | $\varepsilon_{11}$ error | $\varepsilon_{22}$ error |
| 244 | 7.64E-04 | 7.27E-05 | 7.65E-04 | 7.19E-05 | 0.17% | -1.14% |
| 261 | 5.64E-04 | -1.01E-03 | 5.66E-04 | -1.02E-03 | 0.24% | 0.60% |
The maximum difference is 2%. The strain values are close between Abaqus and SesamX.
The following table gives the comparison of the principal stresses on the shell top surface between Abaqus and SesamX.
| Abaqus | SesamX | Comparison | ||||
|---|---|---|---|---|---|---|
| Element id | $\sigma_{11} (MPa)$ | $\sigma_{22} (MPa)$ | $\sigma_{11} (MPa)$ | $\sigma_{22} (MPa)$ | $\sigma_{11}$ error | $\sigma_{22}$ error |
| 244 | 1.71E+00 | 6.93E-01 | 1.71E+00 | 6.91E-01 | 0.20% | -0.17% |
| 261 | 5.56E-01 | -1.86E+00 | 5.56E-01 | -1.86E+00 | 0.03% | -0.03% |
The following table gives the comparison of the principal stresses on the shell bottom surface between Abaqus and SesamX.
| Abaqus | SesamX | Comparison | ||||
|---|---|---|---|---|---|---|
| Element id | $\sigma_{11} (MPa)$ | $\sigma_{22} (MPa)$ | $\sigma_{11} (MPa)$ | $\sigma_{22} (MPa)$ | $\sigma_{11}$ error | $\sigma_{22}$ error |
| 244 | 1.77E+00 | 7.29E-01 | 1.77E+00 | 7.28E-01 | 0.13% | -0.12% |
| 261 | 5.17E-01 | -1.85E+00 | 5.16E-01 | -1.87E+00 | -0.28% | 0.68% |
The maximum difference is 0.7%. The stress values are close between Abaqus and SesamX.
Similarly to the QD4 SHELL-MITC element, we notice a slight discrepancy between the Abaqus S3 element and the SesamX TR3 SHELL-MITC element. To go further you can consult this paper for a thorough validation of the MITC3 element (from which the SesamX TR3 SHELL-MITC element is obtained).